
- Startseite >
- Flüsse >
- Abfluss >
- Bayern >
- Ferthofen >
- Jahresgrafik

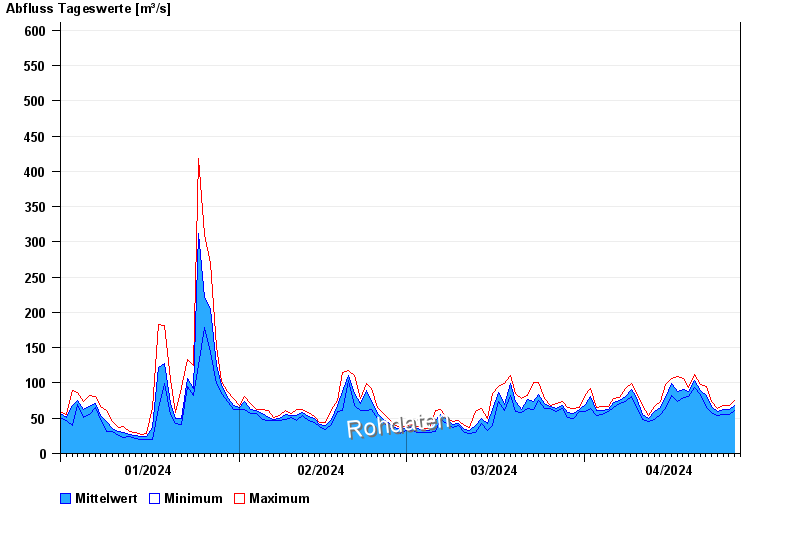
Jahresgrafik Ferthofen / Iller
Abfluss vom 01.01.2024 bis zum 27.04.2024
 Für diesen Pegel sind keine historische Ereignisse hinterlegt.
| Datum | Mittelwert [m³/s] | Maximum [m³/s] | Minimum [m³/s] |
|---|---|---|---|
| 27.04.2024 | 66,8 | 70,6 | 62,8 |
| 26.04.2024 | 61,9 | 68,2 | 55,6 |
| 25.04.2024 | 61,9 | 67,7 | 55,1 |
| 24.04.2024 | 59,2 | 63,9 | 54,3 |
| 23.04.2024 | 67,1 | 73,4 | 58,5 |
| 22.04.2024 | 82,3 | 94,3 | 65,5 |
| 21.04.2024 | 89,3 | 97,3 | 83,6 |
© Bayerisches Landesamt für Umwelt 2024