
- Startseite >
- Flüsse >
- Abfluss >
- Bayern >
- Ferthofen >
- Jahresgrafik

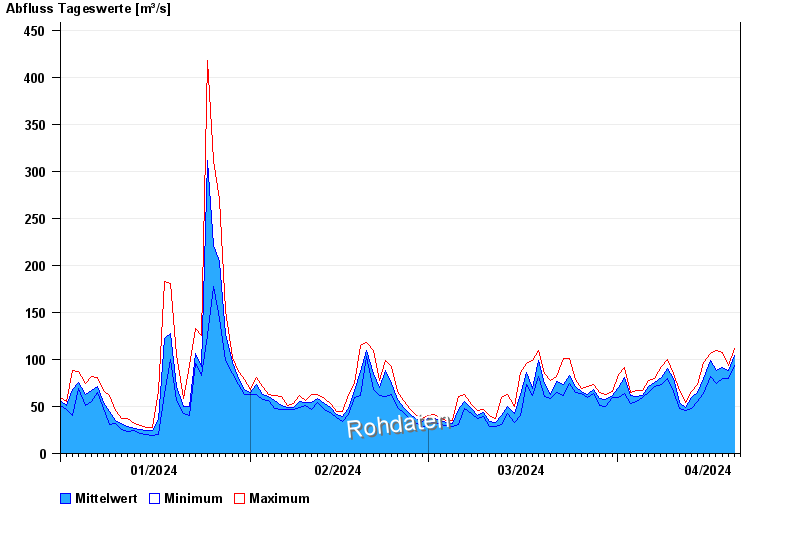
Jahresgrafik Ferthofen / Iller
Abfluss vom 01.01.2024 bis zum 20.04.2024
 Für diesen Pegel sind keine Hauptwerte hinterlegt.
| Datum | Mittelwert [m³/s] | Maximum [m³/s] | Minimum [m³/s] |
|---|---|---|---|
| 20.04.2024 | 95,7 | 98,8 | 93,3 |
| 19.04.2024 | 88,5 | 93,3 | 80,1 |
| 18.04.2024 | 90,9 | 107 | 79,9 |
| 17.04.2024 | 87,9 | 109 | 74,2 |
| 16.04.2024 | 98,9 | 106 | 81,9 |
| 15.04.2024 | 80 | 97,1 | 63,9 |
| 14.04.2024 | 65 | 73,5 | 55,6 |
© Bayerisches Landesamt für Umwelt 2024