
- Start >
- Rivers >
- Waterlevel >
- Regnitz >
- Trunstadt >
- Chart of year

Chart of year Trunstadt / Main
Waterlevel from 19.01.2023 to 18.01.2024
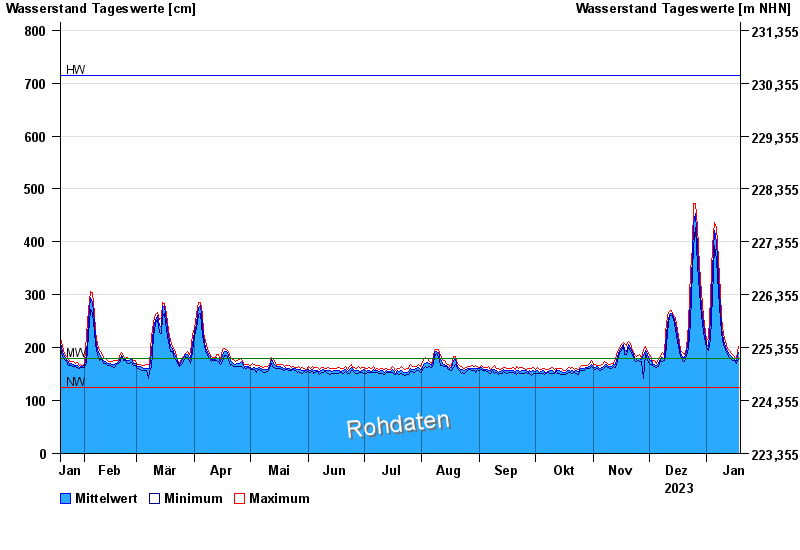
| Date | Mean value [cm] | Maximum [cm] | Minimum [cm] |
|---|---|---|---|
| 18.01.2024 | 190 | 203 | 179 |
| 17.01.2024 | 175 | 179 | 170 |
| 16.01.2024 | 178 | 182 | 176 |
| 15.01.2024 | 179 | 185 | 176 |
| 14.01.2024 | 184 | 189 | 178 |
| 13.01.2024 | 188 | 194 | 181 |
| 12.01.2024 | 192 | 199 | 187 |
© Bayerisches Landesamt für Umwelt 2024