
- Start >
- Rivers >
- Waterlevel >
- Regnitz >
- Lauf >
- Chart of year

Chart of year Lauf / Pegnitz
Waterlevel from 28.04.2024 to 27.04.2025
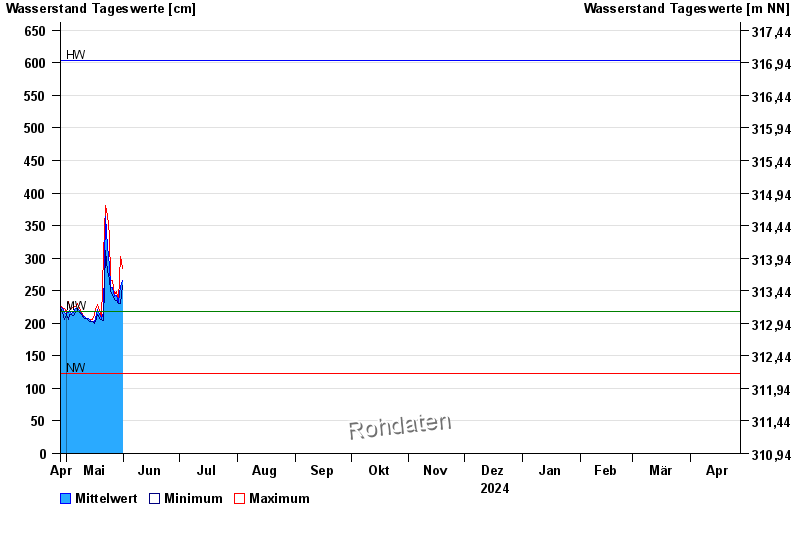
| Date | Mean value [cm] | Maximum [cm] | Minimum [cm] |
|---|---|---|---|
| 09.05.2024 | 217 | 217 | 217 |
| 08.05.2024 | 219 | 223 | 216 |
| 07.05.2024 | 222 | 231 | 219 |
| 06.05.2024 | 223 | 225 | 217 |
| 05.05.2024 | 216 | 224 | 212 |
| 04.05.2024 | 215 | 222 | 213 |
| 03.05.2024 | 219 | 224 | 214 |
© Bayerisches Landesamt für Umwelt 2024