
- Start >
- Rivers >
- Waterlevel >
- Regnitz >
- Lauf >
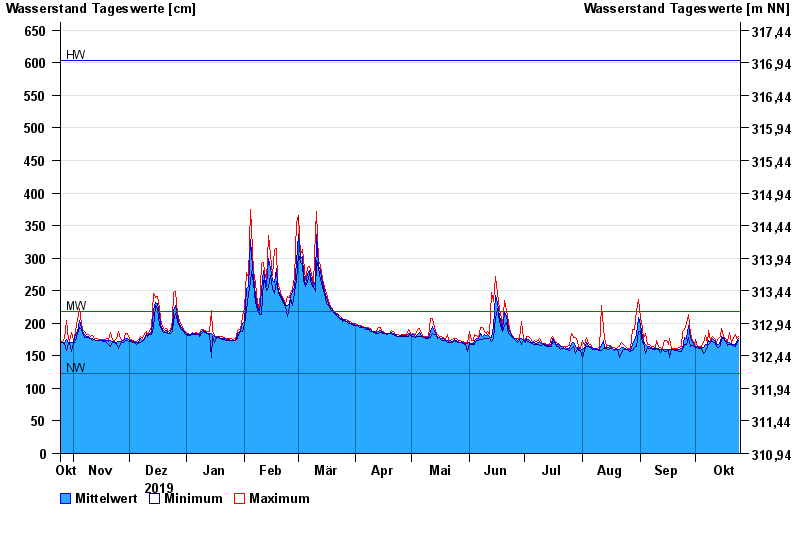
- Chart of year

Chart of year Lauf / Pegnitz
Waterlevel from 25.10.2019 to 24.10.2020
| Date | Mean value [cm] | Maximum [cm] | Minimum [cm] |
|---|---|---|---|
| 24.10.2020 | 176 | 179 | 173 |
| 23.10.2020 | 170 | 177 | 167 |
| 22.10.2020 | 168 | 182 | 164 |
| 21.10.2020 | 168 | 178 | 166 |
| 20.10.2020 | 169 | 171 | 167 |
| 19.10.2020 | 171 | 186 | 168 |
| 18.10.2020 | 171 | 172 | 166 |
© Bayerisches Landesamt für Umwelt 2024