
- Start >
- Rivers >
- Waterlevel >
- Regnitz >
- Füssen >
- Chart of year

Chart of year Füssen / Lech
Waterlevel from 16.10.2019 to 15.10.2020
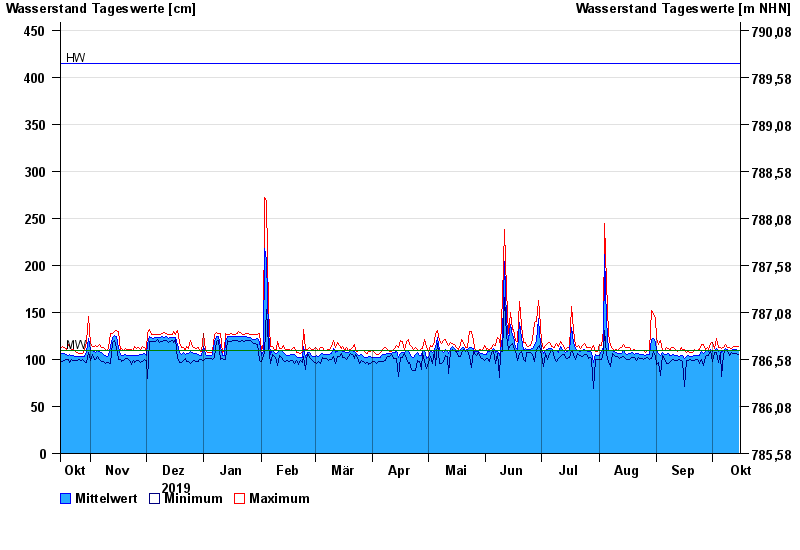
| Date | Mean value [cm] | Maximum [cm] | Minimum [cm] |
|---|---|---|---|
| 15.10.2020 | 110 | 114 | 105 |
| 14.10.2020 | 111 | 114 | 106 |
| 13.10.2020 | 111 | 114 | 106 |
| 12.10.2020 | 111 | 114 | 106 |
| 11.10.2020 | 110 | 112 | 107 |
| 10.10.2020 | 110 | 113 | 104 |
| 09.10.2020 | 111 | 113 | 109 |
© Bayerisches Landesamt für Umwelt 2024