
- Start >
- Rivers >
- Waterlevel >
- Regnitz >
- Frauenkreuz >
- Chart of year

Chart of year Frauenkreuz / Gründlach
Waterlevel from 01.01.2021 to 31.12.2021
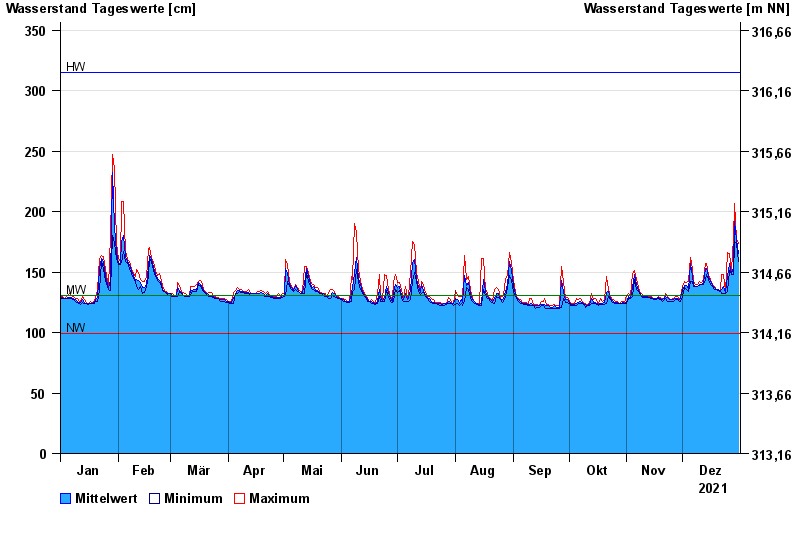
| Date | Mean value [cm] | Maximum [cm] | Minimum [cm] |
|---|---|---|---|
| 31.12.2021 | 165 | 174 | 159 |
| 30.12.2021 | 177 | 178 | 174 |
| 29.12.2021 | 192 | 207 | 175 |
| 28.12.2021 | 154 | 178 | 148 |
| 27.12.2021 | 149 | 151 | 148 |
| 26.12.2021 | 157 | 165 | 151 |
| 25.12.2021 | 146 | 166 | 134 |
© Bayerisches Landesamt für Umwelt 2024