
- Start >
- Rivers >
- Waterlevel >
- Regnitz >
- Erlangen >
- Chart of year

Chart of year Erlangen / Schwabach
Waterlevel from 01.01.2023 to 31.12.2023
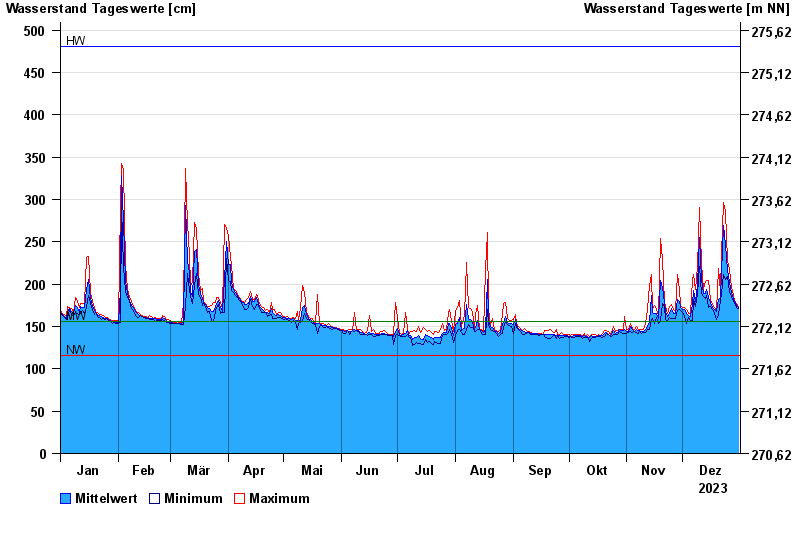
| Date | Mean value [cm] | Maximum [cm] | Minimum [cm] |
|---|---|---|---|
| 31.12.2023 | 173 | 174 | 171 |
| 30.12.2023 | 175 | 177 | 173 |
| 29.12.2023 | 179 | 181 | 177 |
| 28.12.2023 | 183 | 187 | 179 |
| 27.12.2023 | 190 | 196 | 186 |
| 26.12.2023 | 202 | 217 | 191 |
| 25.12.2023 | 216 | 228 | 209 |
© Bayerisches Landesamt für Umwelt 2024