
- Start >
- Rivers >
- Waterlevel >
- Regnitz >
- Büg >
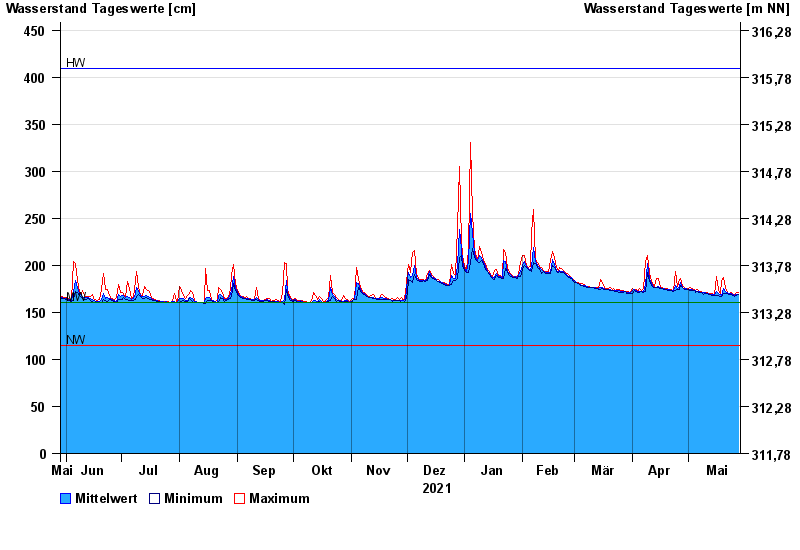
- Chart of year

Chart of year Büg / Schwabach
Waterlevel from 29.05.2021 to 28.05.2022
| Date | Mean value [cm] | Maximum [cm] | Minimum [cm] |
|---|---|---|---|
| 28.05.2022 | 169 | 171 | 169 |
| 27.05.2022 | 169 | 171 | 168 |
| 26.05.2022 | 168 | 169 | 167 |
| 25.05.2022 | 169 | 169 | 168 |
| 24.05.2022 | 170 | 171 | 169 |
| 23.05.2022 | 170 | 170 | 169 |
| 22.05.2022 | 171 | 171 | 170 |
© Bayerisches Landesamt für Umwelt 2024