
- Start >
- Rivers >
- Waterlevel >
- Regnitz >
- Büg >
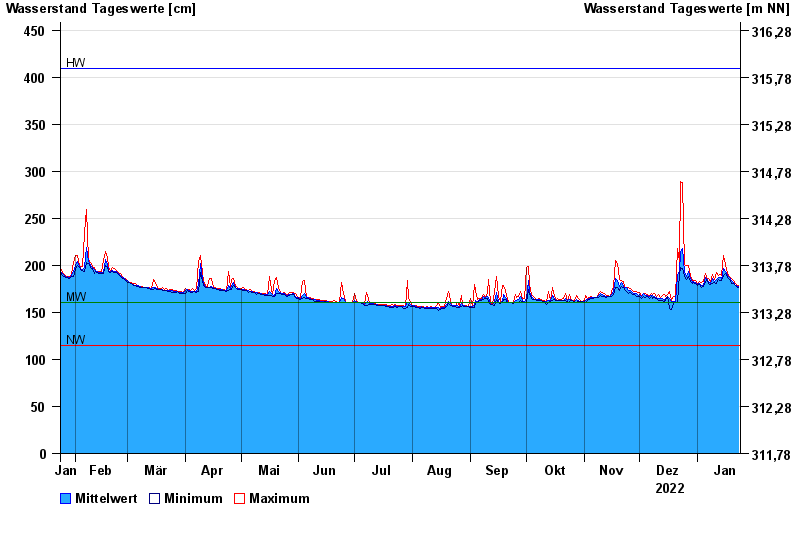
- Chart of year

Chart of year Büg / Schwabach
Waterlevel from 24.01.2022 to 23.01.2023
| Date | Mean value [cm] | Maximum [cm] | Minimum [cm] |
|---|---|---|---|
| 23.01.2023 | 178 | 179 | 177 |
| 22.01.2023 | 179 | 180 | 178 |
| 21.01.2023 | 180 | 182 | 180 |
| 20.01.2023 | 182 | 184 | 181 |
| 19.01.2023 | 184 | 186 | 181 |
| 18.01.2023 | 187 | 188 | 185 |
| 17.01.2023 | 189 | 191 | 187 |
© Bayerisches Landesamt für Umwelt 2024