
- Start >
- Rivers >
- Waterlevel >
- Regnitz >
- Büg >
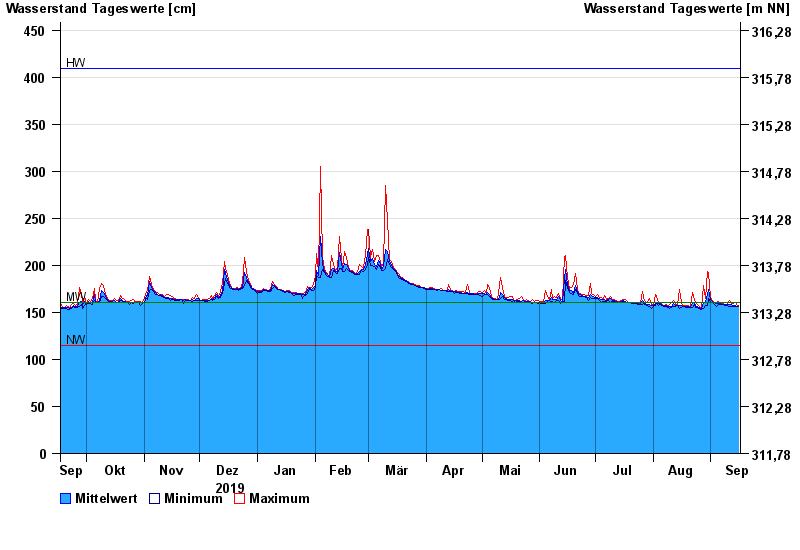
- Chart of year

Chart of year Büg / Schwabach
Waterlevel from 17.09.2019 to 16.09.2020
| Date | Mean value [cm] | Maximum [cm] | Minimum [cm] |
|---|---|---|---|
| 16.09.2020 | 156 | 157 | 156 |
| 15.09.2020 | 156 | 158 | 156 |
| 14.09.2020 | 157 | 161 | 156 |
| 13.09.2020 | 157 | 159 | 156 |
| 12.09.2020 | 158 | 159 | 156 |
| 11.09.2020 | 158 | 163 | 156 |
| 10.09.2020 | 158 | 158 | 157 |
© Bayerisches Landesamt für Umwelt 2024