
- Start >
- Rivers >
- Waterlevel >
- Regnitz >
- Aha >
- Chart of year

Chart of year Aha / Altmühl
Waterlevel from 01.01.2022 to 31.12.2022
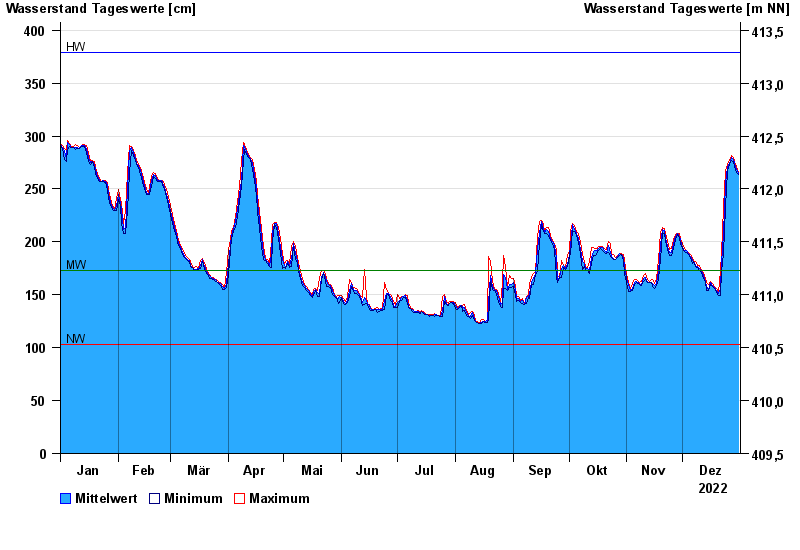
| Date | Mean value [cm] | Maximum [cm] | Minimum [cm] |
|---|---|---|---|
| 31.12.2022 | 265 | 266 | 264 |
| 30.12.2022 | 268 | 271 | 266 |
| 29.12.2022 | 274 | 276 | 271 |
| 28.12.2022 | 278 | 280 | 276 |
| 27.12.2022 | 280 | 282 | 277 |
| 26.12.2022 | 274 | 277 | 273 |
| 25.12.2022 | 271 | 273 | 267 |
© Bayerisches Landesamt für Umwelt 2024