
- Start >
- Rivers >
- Waterlevel >
- Untere Donau >
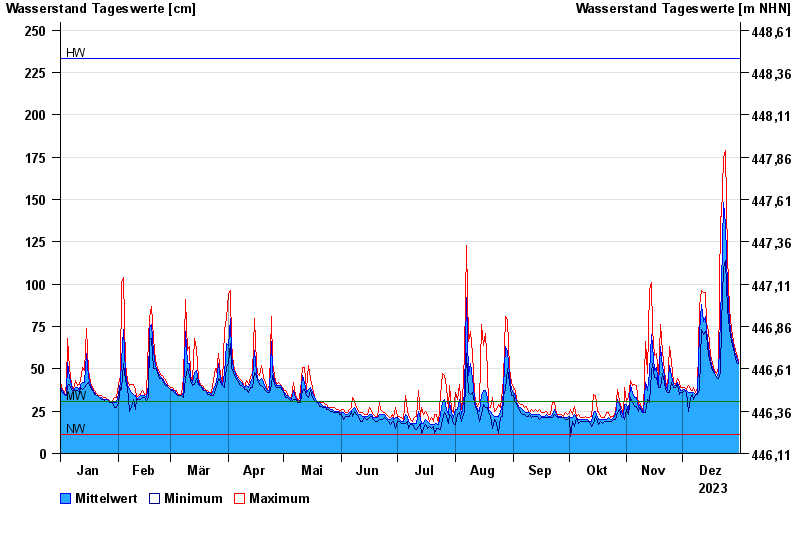
- Teisnach >
- Chart of year

Chart of year Teisnach / Teisnach
Waterlevel from 01.01.2023 to 31.12.2023
| Date | Mean value [cm] | Maximum [cm] | Minimum [cm] |
|---|---|---|---|
| 31.12.2023 | 54 | 55 | 53 |
| 30.12.2023 | 57 | 59 | 54 |
| 29.12.2023 | 60 | 63 | 59 |
| 28.12.2023 | 64 | 66 | 62 |
| 27.12.2023 | 69 | 73 | 66 |
| 26.12.2023 | 78 | 85 | 73 |
| 25.12.2023 | 98 | 117 | 85 |
© Bayerisches Landesamt für Umwelt 2024