
- Start >
- Rivers >
- Waterlevel >
- Untere Donau >
- Pfelling >
- Chart of year

Chart of year Pfelling / Donau
Waterlevel from 22.11.2019 to 21.11.2020
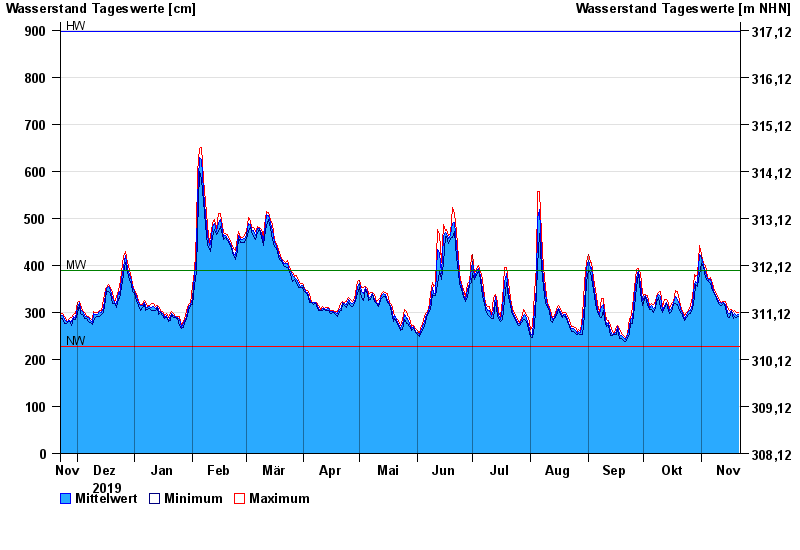
| Date | Mean value [cm] | Maximum [cm] | Minimum [cm] |
|---|---|---|---|
| 21.11.2020 | 296 | 300 | 292 |
| 20.11.2020 | 294 | 300 | 289 |
| 19.11.2020 | 298 | 304 | 292 |
| 18.11.2020 | 293 | 302 | 287 |
| 17.11.2020 | 303 | 307 | 301 |
| 16.11.2020 | 298 | 305 | 289 |
| 15.11.2020 | 299 | 311 | 292 |
© Bayerisches Landesamt für Umwelt 2024