
- Start >
- Rivers >
- Waterlevel >
- Untere Donau >
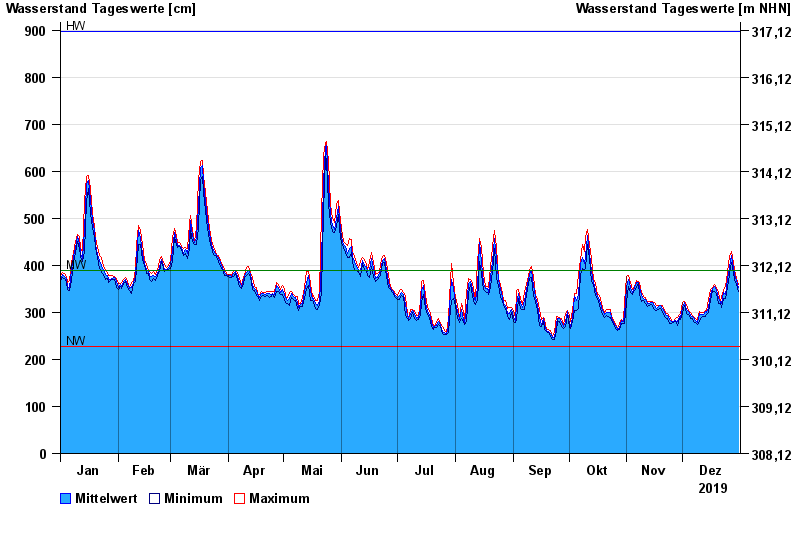
- Pfelling >
- Chart of year

Chart of year Pfelling / Donau
Waterlevel from 01.01.2019 to 31.12.2019
| Date | Mean value [cm] | Maximum [cm] | Minimum [cm] |
|---|---|---|---|
| 31.12.2019 | 352 | 359 | 344 |
| 30.12.2019 | 367 | 373 | 359 |
| 29.12.2019 | 381 | 390 | 371 |
| 28.12.2019 | 393 | 406 | 384 |
| 27.12.2019 | 420 | 429 | 406 |
| 26.12.2019 | 395 | 419 | 380 |
| 25.12.2019 | 371 | 385 | 353 |
© Bayerisches Landesamt für Umwelt 2024