
- Start >
- Rivers >
- Waterlevel >
- Untere Donau >
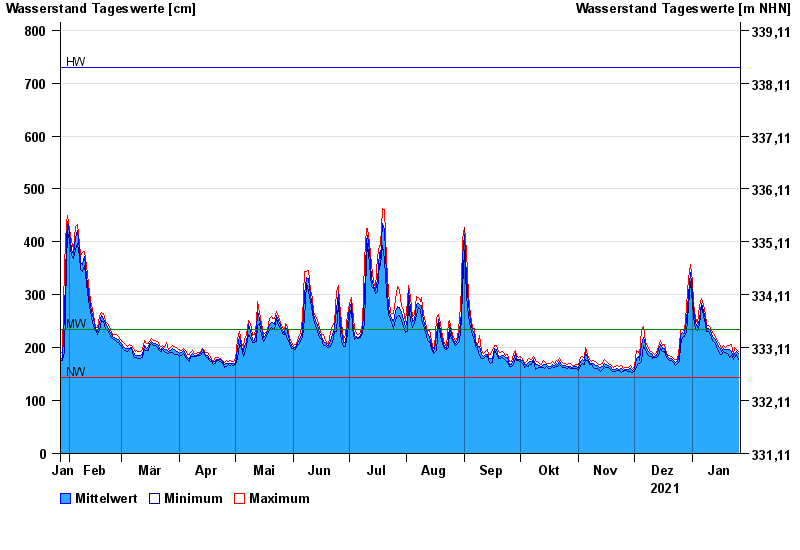
- Oberndorf >
- Chart of year

Chart of year Oberndorf / Donau
Waterlevel from 27.01.2021 to 26.01.2022
| Date | Mean value [cm] | Maximum [cm] | Minimum [cm] |
|---|---|---|---|
| 26.01.2022 | 189 | 193 | 178 |
| 25.01.2022 | 192 | 196 | 188 |
| 24.01.2022 | 189 | 200 | 182 |
| 23.01.2022 | 183 | 188 | 177 |
| 22.01.2022 | 192 | 206 | 185 |
| 21.01.2022 | 196 | 204 | 181 |
| 20.01.2022 | 196 | 204 | 189 |
© Bayerisches Landesamt für Umwelt 2024