
- Start >
- Rivers >
- Waterlevel >
- Untere Donau >
- Oberndorf >
- Chart of year

Chart of year Oberndorf / Donau
Waterlevel from 20.04.2024 to 19.04.2025
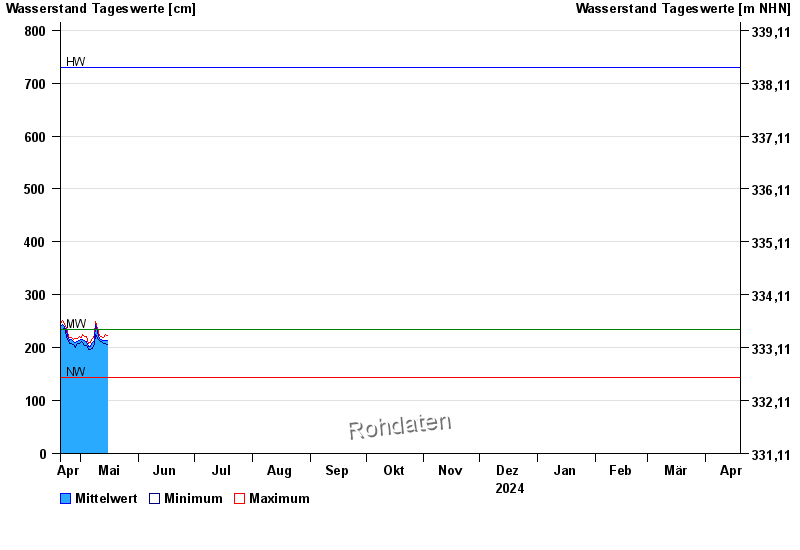
| Date | Mean value [cm] | Maximum [cm] | Minimum [cm] |
|---|---|---|---|
| 02.05.2024 | 213 | 217 | 210 |
| 01.05.2024 | 216 | 220 | 212 |
| 30.04.2024 | 213 | 221 | 207 |
| 29.04.2024 | 212 | 218 | 207 |
| 28.04.2024 | 209 | 217 | 201 |
| 27.04.2024 | 211 | 215 | 206 |
| 26.04.2024 | 215 | 220 | 207 |
© Bayerisches Landesamt für Umwelt 2024