
- Start >
- Rivers >
- Waterlevel >
- Untere Donau >
- Nittenau >
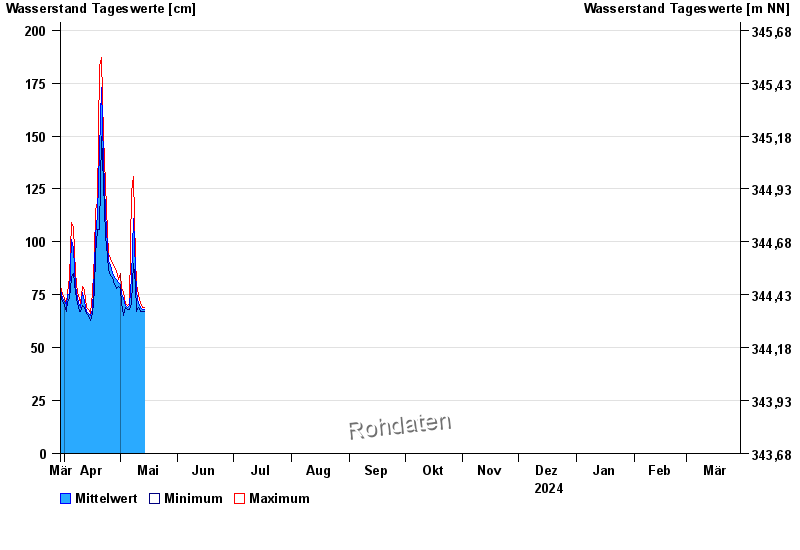
- Chart of year

Chart of year Nittenau / Regen
Waterlevel from 30.03.2024 to 29.03.2025
| Date | Mean value [cm] | Maximum [cm] | Minimum [cm] |
|---|---|---|---|
| 20.06.2024 | 82 | 85 | 80 |
| 19.06.2024 | 88 | 93 | 84 |
| 18.06.2024 | 93 | 97 | 91 |
| 17.06.2024 | 95 | 97 | 94 |
| 16.06.2024 | 98 | 99 | 96 |
| 15.06.2024 | 103 | 105 | 99 |
| 14.06.2024 | 108 | 109 | 105 |
© Bayerisches Landesamt für Umwelt 2024