
- Start >
- Rivers >
- Waterlevel >
- Untere Donau >
- Marienthal >
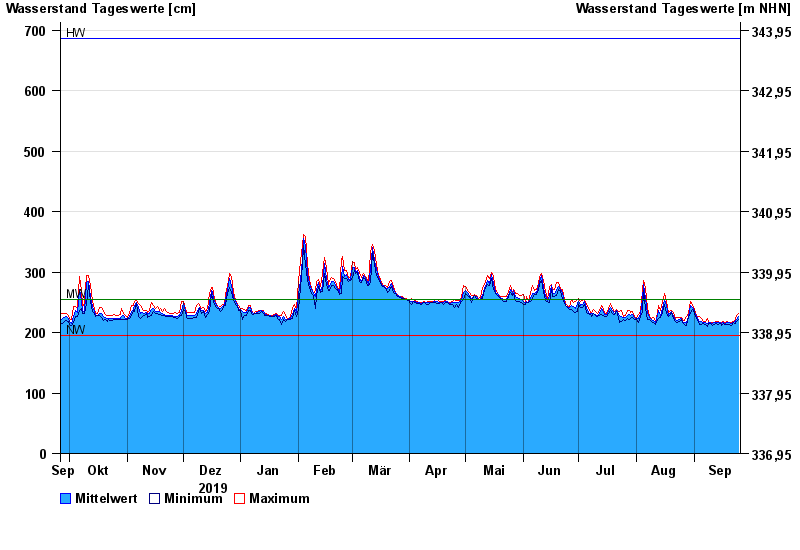
- Chart of year

Chart of year Marienthal / Regen
Waterlevel from 26.09.2019 to 25.09.2020
| Date | Mean value [cm] | Maximum [cm] | Minimum [cm] |
|---|---|---|---|
| 25.09.2020 | 226 | 231 | 221 |
| 24.09.2020 | 221 | 228 | 219 |
| 23.09.2020 | 218 | 221 | 215 |
| 22.09.2020 | 217 | 218 | 216 |
| 21.09.2020 | 215 | 217 | 212 |
| 20.09.2020 | 216 | 217 | 214 |
| 19.09.2020 | 216 | 219 | 213 |
© Bayerisches Landesamt für Umwelt 2024