
- Start >
- Rivers >
- Waterlevel >
- Untere Donau >
- Hörmannsberg >
- Chart of year

Chart of year Hörmannsberg / Gaißa
Waterlevel from 23.01.2024 to 22.01.2025
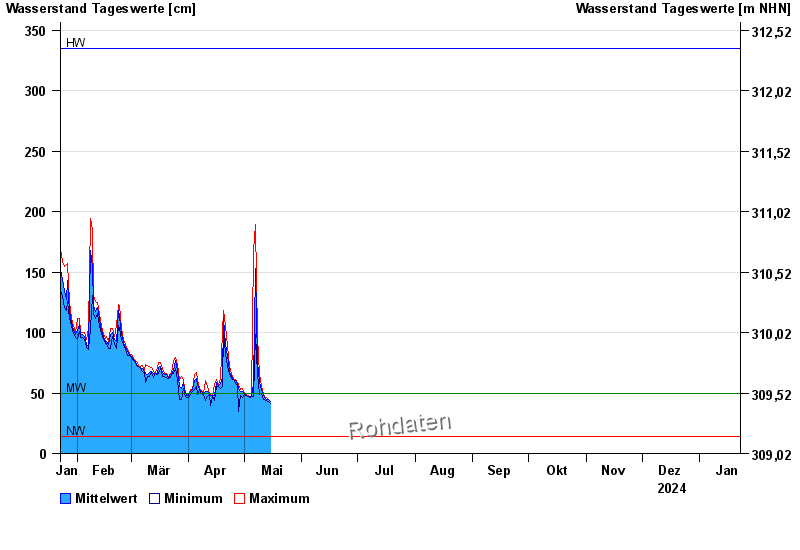
| Date | Mean value [cm] | Maximum [cm] | Minimum [cm] |
|---|---|---|---|
| 26.05.2024 | 64 | 64 | 64 |
| 25.05.2024 | 72 | 80 | 64 |
| 24.05.2024 | 84 | 86 | 80 |
| 23.05.2024 | 101 | 136 | 85 |
| 22.05.2024 | 172 | 205 | 137 |
| 21.05.2024 | 65 | 176 | 46 |
| 20.05.2024 | 54 | 60 | 52 |
© Bayerisches Landesamt für Umwelt 2024