
- Start >
- Rivers >
- Waterlevel >
- Untere Donau >
- Hörmannsberg >
- Chart of year

Chart of year Hörmannsberg / Gaißa
Waterlevel from 01.01.2024 to 31.12.2024
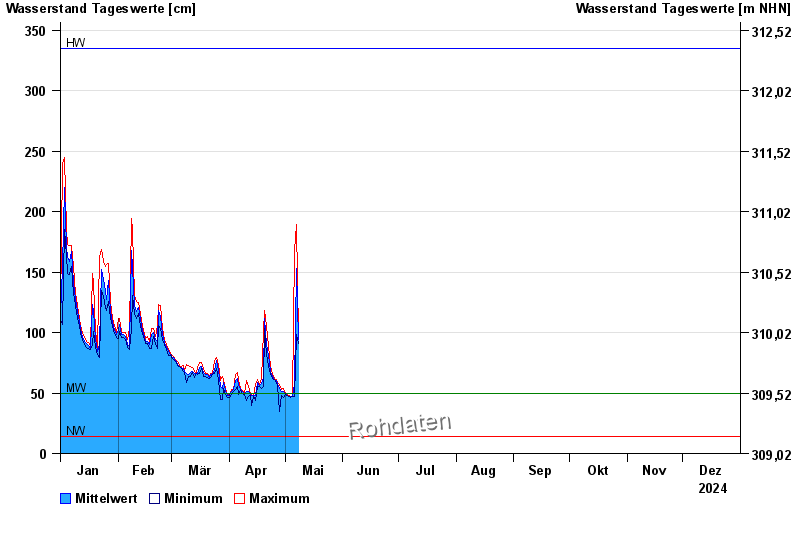
| Date | Mean value [cm] | Maximum [cm] | Minimum [cm] |
|---|---|---|---|
| 09.05.2024 | 63 | 64 | 63 |
| 08.05.2024 | 76 | 97 | 64 |
| 07.05.2024 | 153 | 189 | 98 |
| 06.05.2024 | 58 | 168 | 47 |
| 05.05.2024 | 47 | 47 | 47 |
| 04.05.2024 | 47 | 47 | 46 |
| 03.05.2024 | 47 | 48 | 47 |
© Bayerisches Landesamt für Umwelt 2024