
- Start >
- Rivers >
- Waterlevel >
- Untere Donau >
- Grafenau >
- Chart of year

Chart of year Grafenau / Kleine Ohe
Waterlevel from 29.03.2024 to 28.03.2025
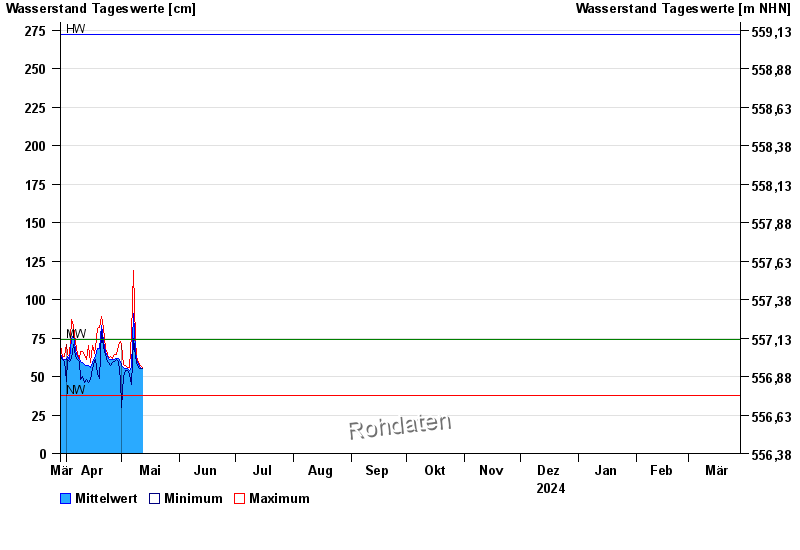
| Date | Mean value [cm] | Maximum [cm] | Minimum [cm] |
|---|---|---|---|
| 22.06.2024 | 68 | 72 | 63 |
| 21.06.2024 | 55 | 66 | 53 |
| 20.06.2024 | 56 | 58 | 54 |
| 19.06.2024 | 57 | 58 | 53 |
| 18.06.2024 | 60 | 70 | 46 |
| 17.06.2024 | 59 | 61 | 57 |
| 16.06.2024 | 60 | 61 | 59 |
© Bayerisches Landesamt für Umwelt 2024