
- Start >
- Rivers >
- Waterlevel >
- Untere Donau >
- Eschlkam >
- Chart of year

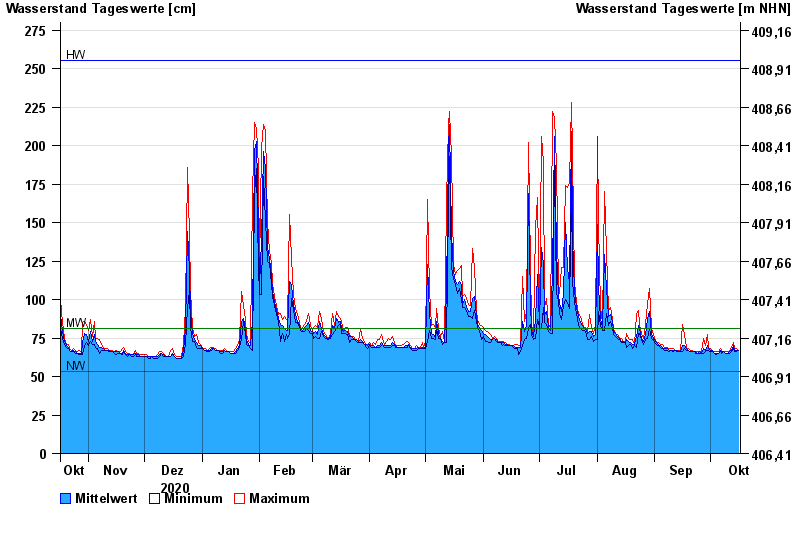
Chart of year Eschlkam / Chamb
Waterlevel from 17.10.2020 to 16.10.2021
| Date | Mean value [cm] | Maximum [cm] | Minimum [cm] |
|---|---|---|---|
| 16.10.2021 | 67 | 67 | 67 |
| 15.10.2021 | 67 | 68 | 66 |
| 14.10.2021 | 67 | 68 | 66 |
| 13.10.2021 | 70 | 72 | 68 |
| 12.10.2021 | 67 | 69 | 66 |
| 11.10.2021 | 66 | 66 | 65 |
| 10.10.2021 | 65 | 66 | 65 |
© Bayerisches Landesamt für Umwelt 2024