
- Start >
- Rivers >
- Waterlevel >
- Untere Donau >
- Bad Tölz Brücke >
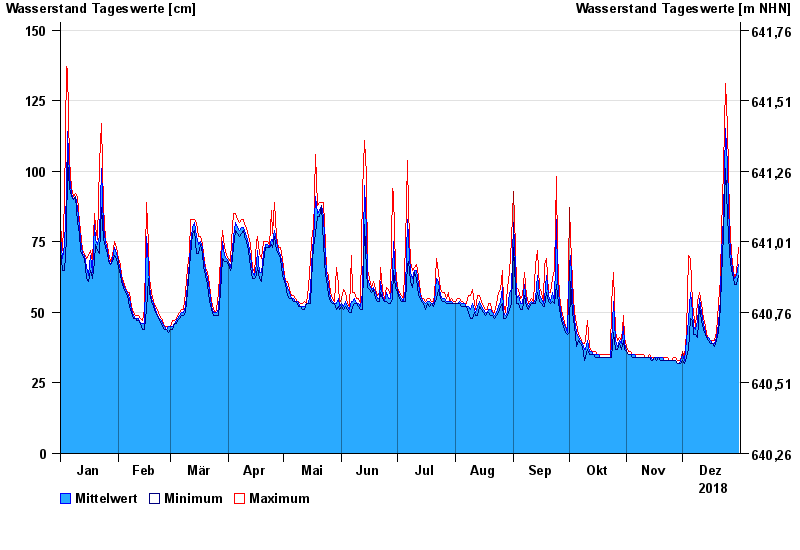
- Chart of year

Chart of year Bad Tölz Brücke / Isar
Waterlevel from 01.01.2018 to 31.12.2018
| Date | Mean value [cm] | Maximum [cm] | Minimum [cm] |
|---|---|---|---|
| 31.12.2018 | 67 | 73 | 63 |
| 30.12.2018 | 63 | 64 | 60 |
| 29.12.2018 | 62 | 62 | 60 |
| 28.12.2018 | 63 | 65 | 62 |
| 27.12.2018 | 68 | 71 | 65 |
| 26.12.2018 | 77 | 84 | 71 |
| 25.12.2018 | 102 | 116 | 84 |
© Bayerisches Landesamt für Umwelt 2024