
- Start >
- Rivers >
- Waterlevel >
- Naab - Regen >
- Wildenau >
- Chart of year

Chart of year Wildenau / Haidenaab
Waterlevel from 01.01.2021 to 31.12.2021
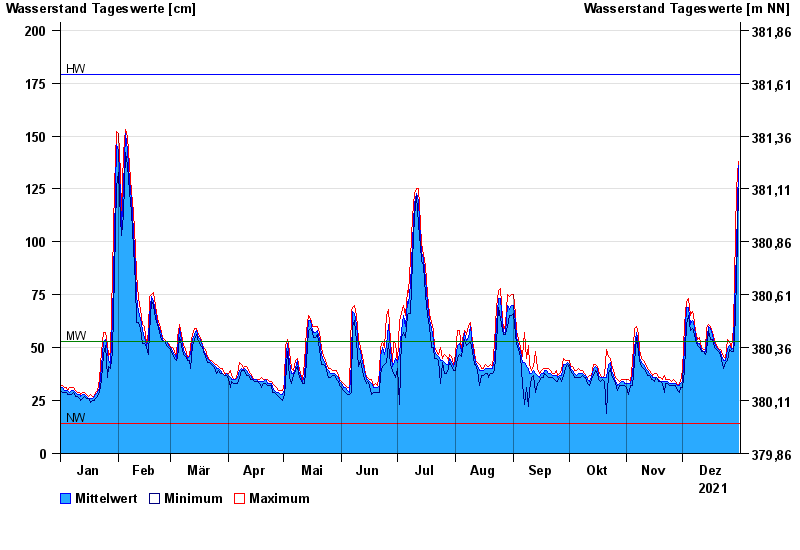
| Date | Mean value [cm] | Maximum [cm] | Minimum [cm] |
|---|---|---|---|
| 31.12.2021 | 136 | 138 | 125 |
| 30.12.2021 | 96 | 125 | 82 |
| 29.12.2021 | 69 | 82 | 53 |
| 28.12.2021 | 50 | 59 | 48 |
| 27.12.2021 | 49 | 50 | 48 |
| 26.12.2021 | 51 | 53 | 49 |
| 25.12.2021 | 49 | 54 | 44 |
© Bayerisches Landesamt für Umwelt 2024