
- Start >
- Rivers >
- Waterlevel >
- Naab - Regen >
- Weiden >
- Chart of year

Chart of year Weiden / Waldnaab
Waterlevel from 13.05.2020 to 12.05.2021
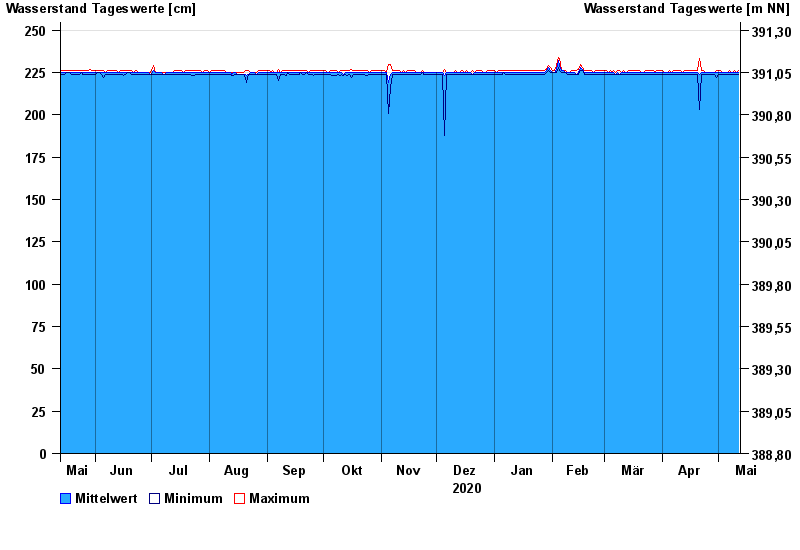
| Date | Mean value [cm] | Maximum [cm] | Minimum [cm] |
|---|---|---|---|
| 12.05.2021 | 225 | 226 | 224 |
| 11.05.2021 | 225 | 225 | 224 |
| 10.05.2021 | 225 | 226 | 224 |
| 09.05.2021 | 225 | 225 | 224 |
| 08.05.2021 | 225 | 225 | 224 |
| 07.05.2021 | 225 | 226 | 224 |
| 06.05.2021 | 225 | 225 | 224 |
© Bayerisches Landesamt für Umwelt 2024