
- Start >
- Rivers >
- Waterlevel >
- Naab - Regen >
- Unterköblitz >
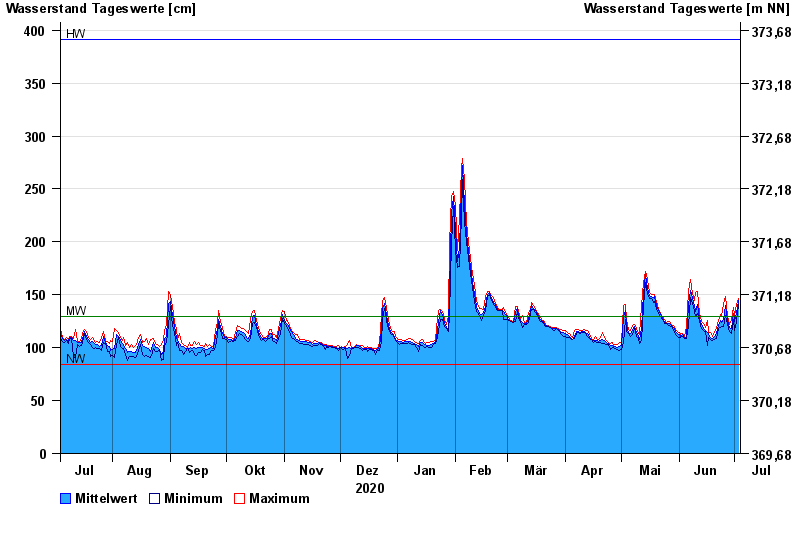
- Chart of year

Chart of year Unterköblitz / Naab
Waterlevel from 04.07.2020 to 03.07.2021
| Date | Mean value [cm] | Maximum [cm] | Minimum [cm] |
|---|---|---|---|
| 03.07.2021 | 145 | 146 | 141 |
| 02.07.2021 | 132 | 141 | 125 |
| 01.07.2021 | 125 | 130 | 116 |
| 30.06.2021 | 132 | 138 | 127 |
| 29.06.2021 | 118 | 127 | 113 |
| 28.06.2021 | 119 | 122 | 115 |
| 27.06.2021 | 126 | 130 | 122 |
© Bayerisches Landesamt für Umwelt 2024