
- Start >
- Rivers >
- Waterlevel >
- Naab - Regen >
- Unterbruck Flutmulde >
- Chart of year

Chart of year Unterbruck Flutmulde / Haidenaab
Waterlevel from 28.01.2020 to 27.01.2021
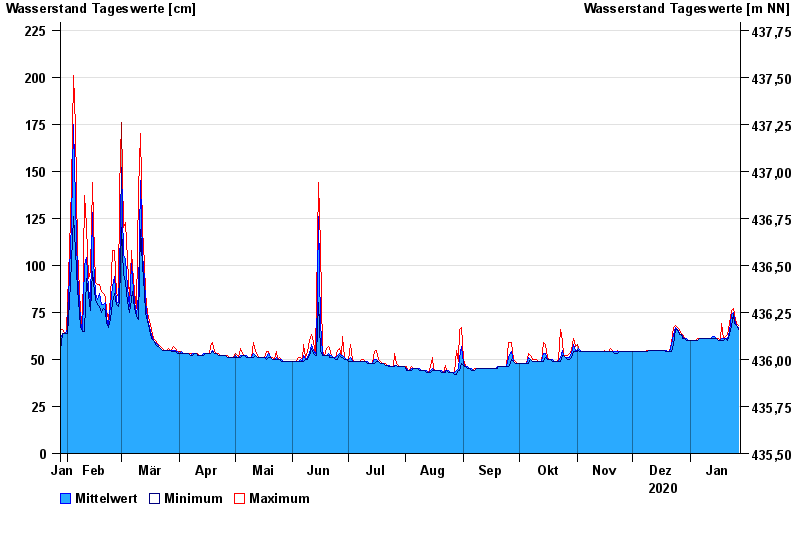
| Date | Mean value [cm] | Maximum [cm] | Minimum [cm] |
|---|---|---|---|
| 27.01.2021 | 67 | 68 | 66 |
| 26.01.2021 | 68 | 69 | 68 |
| 25.01.2021 | 71 | 74 | 69 |
| 24.01.2021 | 75 | 77 | 74 |
| 23.01.2021 | 74 | 76 | 68 |
| 22.01.2021 | 65 | 69 | 63 |
| 21.01.2021 | 61 | 63 | 60 |
© Bayerisches Landesamt für Umwelt 2024