
- Start >
- Rivers >
- Waterlevel >
- Naab - Regen >
- Unterbruck Flutmulde >
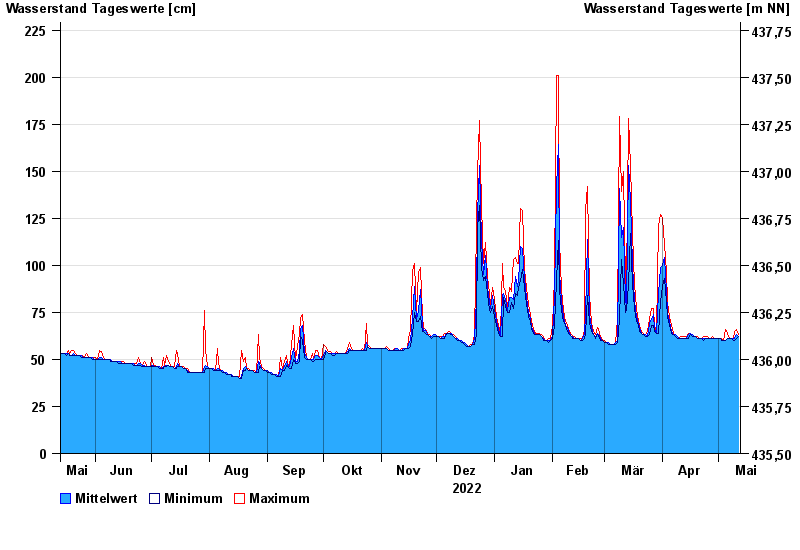
- Chart of year

Chart of year Unterbruck Flutmulde / Haidenaab
Waterlevel from 13.05.2022 to 12.05.2023
| Date | Mean value [cm] | Maximum [cm] | Minimum [cm] |
|---|---|---|---|
| 12.05.2023 | 62 | 63 | 62 |
| 11.05.2023 | 63 | 66 | 61 |
| 10.05.2023 | 61 | 65 | 60 |
| 09.05.2023 | 61 | 61 | 60 |
| 08.05.2023 | 61 | 61 | 61 |
| 07.05.2023 | 61 | 61 | 61 |
| 06.05.2023 | 61 | 64 | 61 |
© Bayerisches Landesamt für Umwelt 2024