
- Start >
- Rivers >
- Waterlevel >
- Naab - Regen >
- Unterbruck >
- Chart of year

Chart of year Unterbruck / Haidenaab
Waterlevel from 30.09.2021 to 29.09.2022
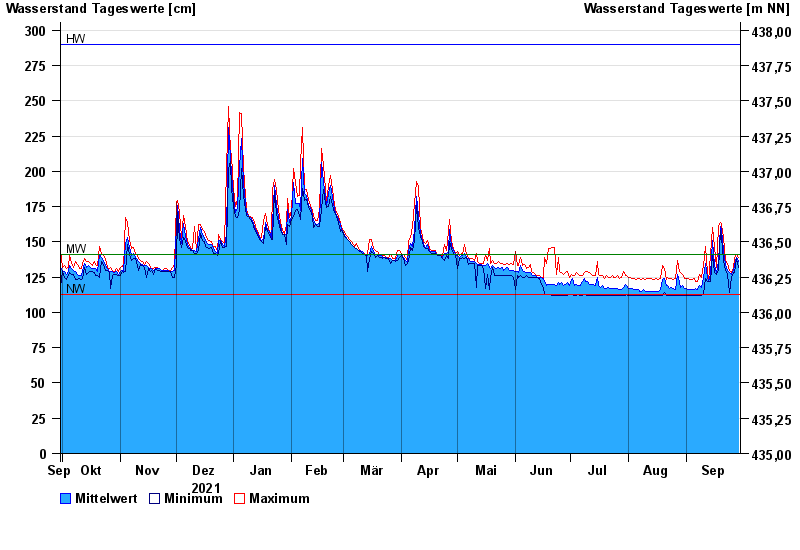
| Date | Mean value [cm] | Maximum [cm] | Minimum [cm] |
|---|---|---|---|
| 29.09.2022 | 136 | 139 | 132 |
| 28.09.2022 | 139 | 141 | 138 |
| 27.09.2022 | 133 | 138 | 128 |
| 26.09.2022 | 130 | 131 | 128 |
| 25.09.2022 | 127 | 128 | 125 |
| 24.09.2022 | 128 | 130 | 114 |
| 23.09.2022 | 130 | 135 | 127 |
© Bayerisches Landesamt für Umwelt 2024