
- Start >
- Rivers >
- Waterlevel >
- Naab - Regen >
- Schmidmühlen >
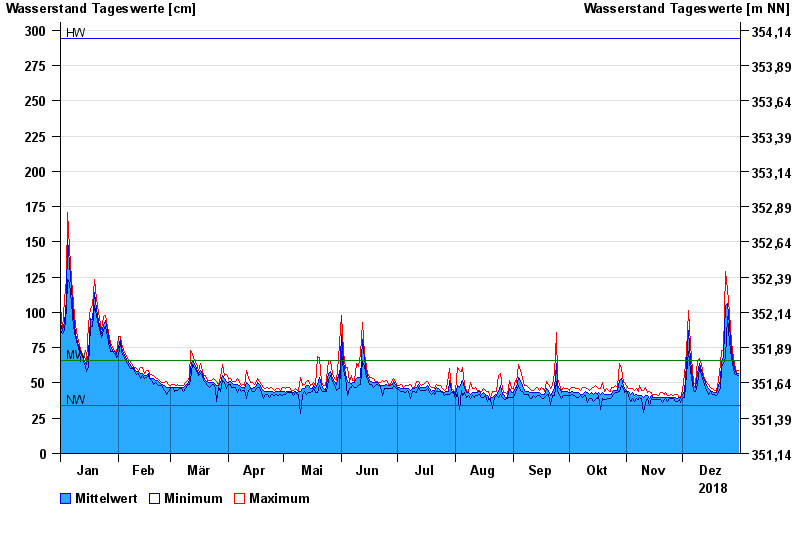
- Chart of year

Chart of year Schmidmühlen / Vils
Waterlevel from 01.01.2018 to 31.12.2018
| Date | Mean value [cm] | Maximum [cm] | Minimum [cm] |
|---|---|---|---|
| 31.12.2018 | 57 | 59 | 55 |
| 30.12.2018 | 57 | 58 | 56 |
| 29.12.2018 | 60 | 63 | 57 |
| 28.12.2018 | 64 | 68 | 60 |
| 27.12.2018 | 72 | 79 | 68 |
| 26.12.2018 | 91 | 100 | 79 |
| 25.12.2018 | 106 | 116 | 97 |
© Bayerisches Landesamt für Umwelt 2024