
- Start >
- Rivers >
- Waterlevel >
- Naab - Regen >
- Michelfeld >
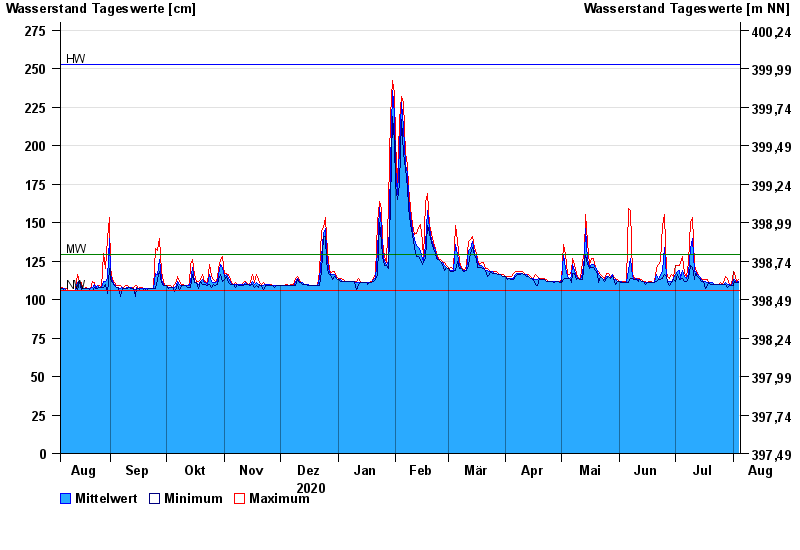
- Chart of year

Chart of year Michelfeld / Pegnitz
Waterlevel from 05.08.2020 to 04.08.2021
| Date | Mean value [cm] | Maximum [cm] | Minimum [cm] |
|---|---|---|---|
| 04.08.2021 | 112 | 113 | 111 |
| 03.08.2021 | 111 | 112 | 111 |
| 02.08.2021 | 113 | 117 | 112 |
| 01.08.2021 | 113 | 118 | 109 |
| 31.07.2021 | 109 | 110 | 109 |
| 30.07.2021 | 110 | 110 | 109 |
| 29.07.2021 | 110 | 114 | 108 |
© Bayerisches Landesamt für Umwelt 2024