
- Start >
- Rivers >
- Waterlevel >
- Naab - Regen >
- Leming >
- Chart of year

Chart of year Leming / Freybach
Waterlevel from 01.01.2022 to 31.12.2022
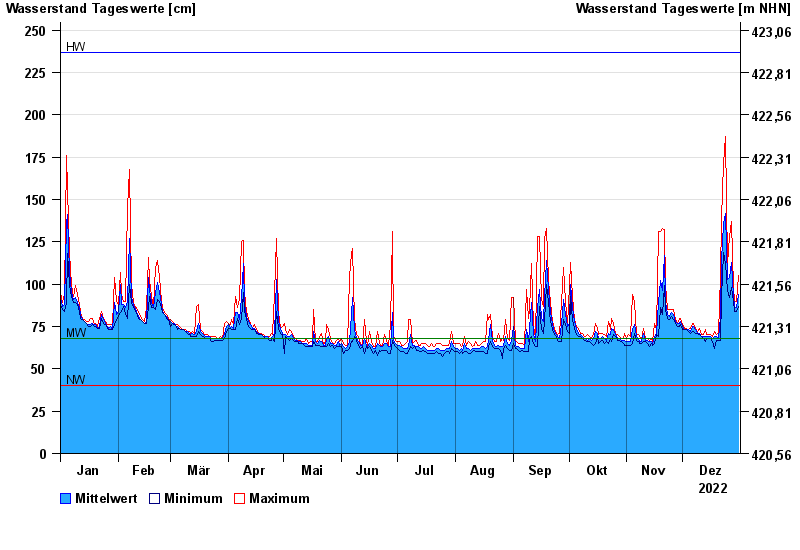
| Date | Mean value [cm] | Maximum [cm] | Minimum [cm] |
|---|---|---|---|
| 31.12.2022 | 94 | 105 | 87 |
| 30.12.2022 | 86 | 90 | 84 |
| 29.12.2022 | 87 | 90 | 84 |
| 28.12.2022 | 93 | 98 | 90 |
| 27.12.2022 | 113 | 137 | 98 |
| 26.12.2022 | 104 | 128 | 92 |
| 25.12.2022 | 103 | 112 | 96 |
© Bayerisches Landesamt für Umwelt 2024