
- Start >
- Rivers >
- Waterlevel >
- Naab - Regen >
- Grafenwöhr >
- Chart of year

Chart of year Grafenwöhr / Creußen
Waterlevel from 01.01.2022 to 31.12.2022
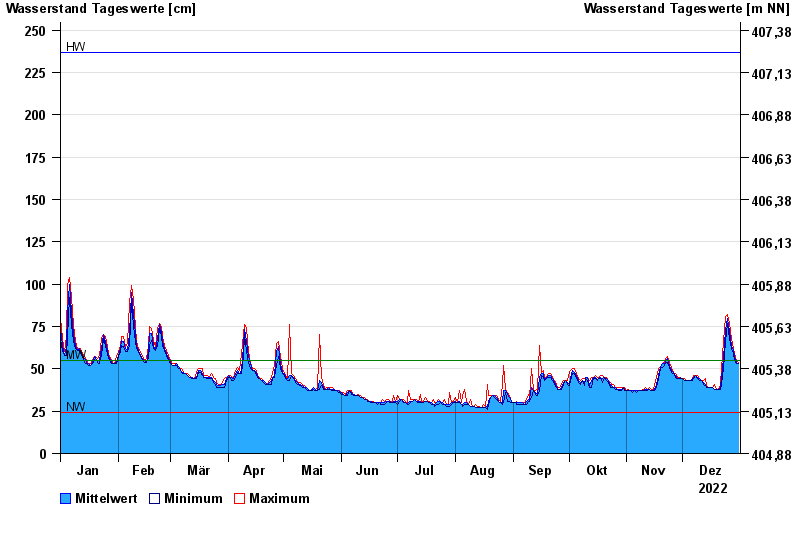
| Date | Mean value [cm] | Maximum [cm] | Minimum [cm] |
|---|---|---|---|
| 31.12.2022 | 53 | 54 | 53 |
| 30.12.2022 | 54 | 55 | 53 |
| 29.12.2022 | 57 | 59 | 55 |
| 28.12.2022 | 61 | 62 | 59 |
| 27.12.2022 | 64 | 68 | 62 |
| 26.12.2022 | 72 | 77 | 68 |
| 25.12.2022 | 80 | 82 | 77 |
© Bayerisches Landesamt für Umwelt 2024