
- Start >
- Rivers >
- Waterlevel >
- Naab - Regen >
- Grafenwöhr >
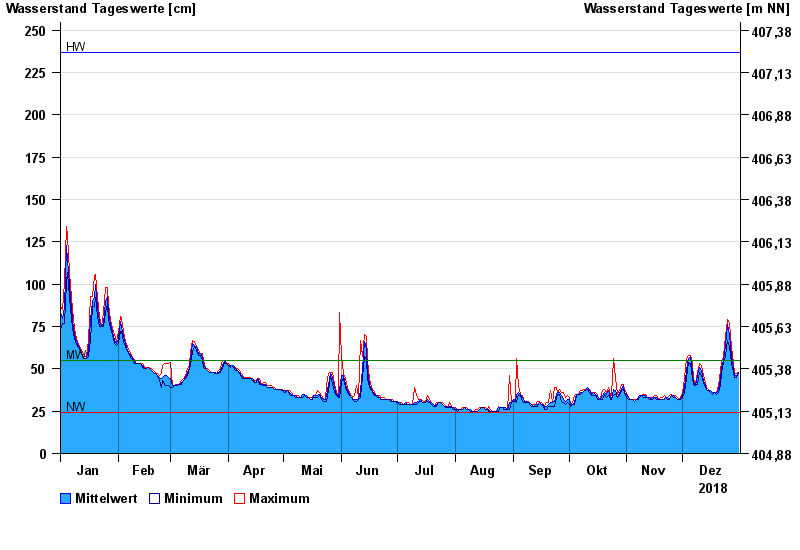
- Chart of year

Chart of year Grafenwöhr / Creußen
Waterlevel from 01.01.2018 to 31.12.2018
| Date | Mean value [cm] | Maximum [cm] | Minimum [cm] |
|---|---|---|---|
| 31.12.2018 | 48 | 48 | 47 |
| 30.12.2018 | 46 | 47 | 45 |
| 29.12.2018 | 46 | 48 | 45 |
| 28.12.2018 | 50 | 53 | 48 |
| 27.12.2018 | 57 | 63 | 53 |
| 26.12.2018 | 70 | 77 | 63 |
| 25.12.2018 | 76 | 79 | 67 |
© Bayerisches Landesamt für Umwelt 2024