
- Start >
- Rivers >
- Waterlevel >
- Unterer Main >
- Weilbach >
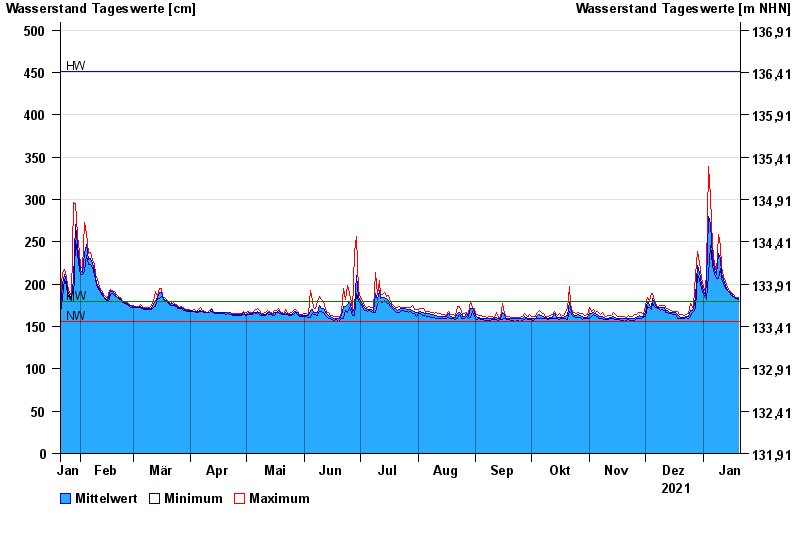
- Chart of year

Chart of year Weilbach / Mud
Waterlevel from 21.01.2021 to 20.01.2022
| Date | Mean value [cm] | Maximum [cm] | Minimum [cm] |
|---|---|---|---|
| 20.01.2022 | 183 | 184 | 182 |
| 19.01.2022 | 183 | 184 | 183 |
| 18.01.2022 | 185 | 186 | 184 |
| 17.01.2022 | 186 | 188 | 185 |
| 16.01.2022 | 189 | 190 | 187 |
| 15.01.2022 | 191 | 192 | 190 |
| 14.01.2022 | 193 | 196 | 192 |
© Bayerisches Landesamt für Umwelt 2024