
- Start >
- Rivers >
- Waterlevel >
- Unterer Main >
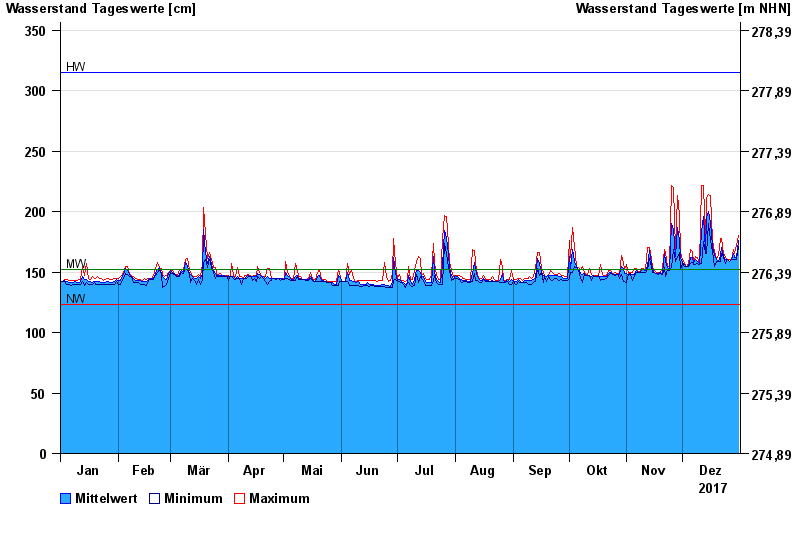
- Pfarrweisach >
- Chart of year

Chart of year Pfarrweisach / Weisach
Waterlevel from 01.01.2017 to 31.12.2017
| Date | Mean value [cm] | Maximum [cm] | Minimum [cm] |
|---|---|---|---|
| 31.12.2017 | 176 | 180 | 171 |
| 30.12.2017 | 162 | 172 | 160 |
| 29.12.2017 | 162 | 165 | 160 |
| 28.12.2017 | 165 | 169 | 160 |
| 27.12.2017 | 160 | 160 | 160 |
| 26.12.2017 | 159 | 160 | 159 |
| 25.12.2017 | 160 | 160 | 160 |
© Bayerisches Landesamt für Umwelt 2024