
- Start >
- Rivers >
- Waterlevel >
- Unterer Main >
- Lohr >
- Chart of year

Chart of year Lohr / Baunach
Waterlevel from 30.03.2024 to 29.03.2025
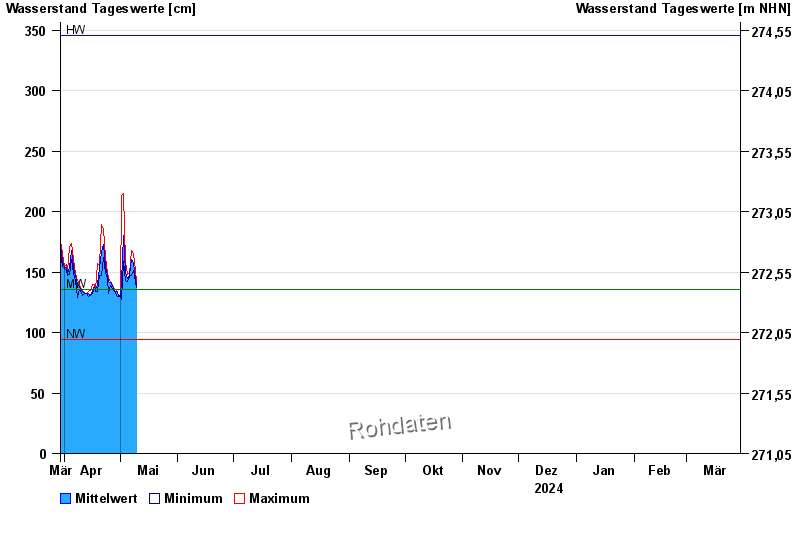
| Date | Mean value [cm] | Maximum [cm] | Minimum [cm] |
|---|---|---|---|
| 29.04.2024 | 134 | 136 | 133 |
| 28.04.2024 | 135 | 136 | 134 |
| 27.04.2024 | 138 | 140 | 136 |
| 26.04.2024 | 141 | 142 | 139 |
| 25.04.2024 | 142 | 145 | 132 |
| 24.04.2024 | 147 | 150 | 145 |
| 23.04.2024 | 155 | 162 | 150 |
© Bayerisches Landesamt für Umwelt 2024