
- Start >
- Rivers >
- Waterlevel >
- Unterer Main >
- Laubendorf >
- Chart of year

Chart of year Laubendorf / Zenn
Waterlevel from 01.01.2024 to 31.12.2024
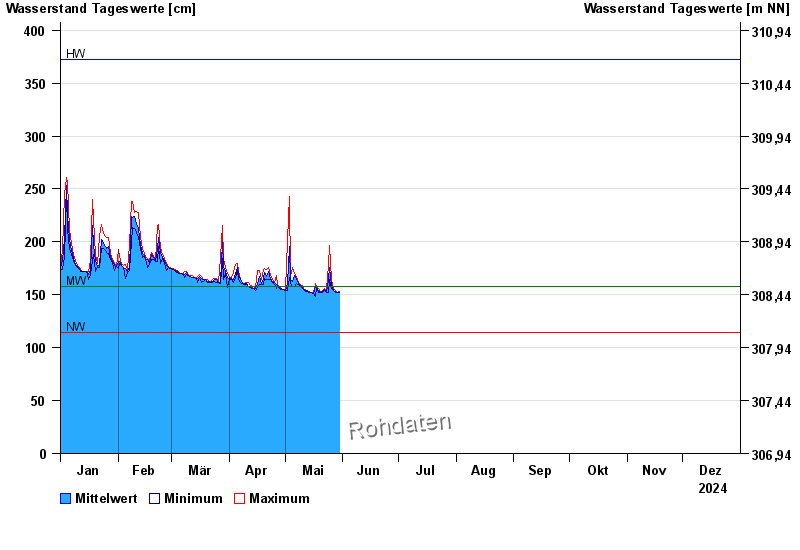
| Date | Mean value [cm] | Maximum [cm] | Minimum [cm] |
|---|---|---|---|
| 08.05.2024 | 162 | 162 | 161 |
| 07.05.2024 | 165 | 167 | 161 |
| 06.05.2024 | 168 | 170 | 158 |
| 05.05.2024 | 163 | 176 | 158 |
| 04.05.2024 | 164 | 167 | 161 |
| 03.05.2024 | 196 | 243 | 166 |
| 02.05.2024 | 161 | 201 | 154 |
© Bayerisches Landesamt für Umwelt 2024