
- Start >
- Rivers >
- Waterlevel >
- Unterer Main >
- Gollmuthhausen >
- Chart of year

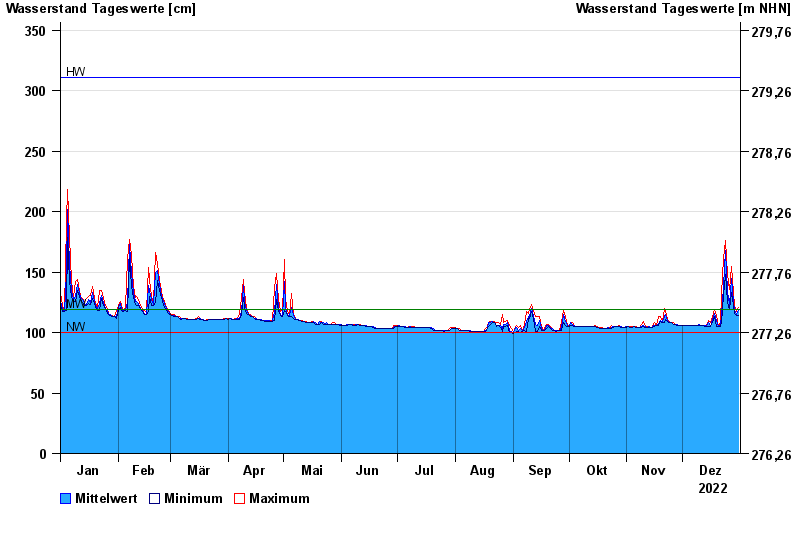
Chart of year Gollmuthhausen / Milz
Waterlevel from 01.01.2022 to 31.12.2022
| Date | Mean value [cm] | Maximum [cm] | Minimum [cm] |
|---|---|---|---|
| 31.12.2022 | 118 | 121 | 114 |
| 30.12.2022 | 115 | 117 | 114 |
| 29.12.2022 | 118 | 122 | 116 |
| 28.12.2022 | 126 | 133 | 122 |
| 27.12.2022 | 145 | 155 | 133 |
| 26.12.2022 | 123 | 136 | 119 |
| 25.12.2022 | 134 | 148 | 125 |
© Bayerisches Landesamt für Umwelt 2024