
- Start >
- Rivers >
- Waterlevel >
- Unterer Main >
- Bruckberg >
- Chart of year

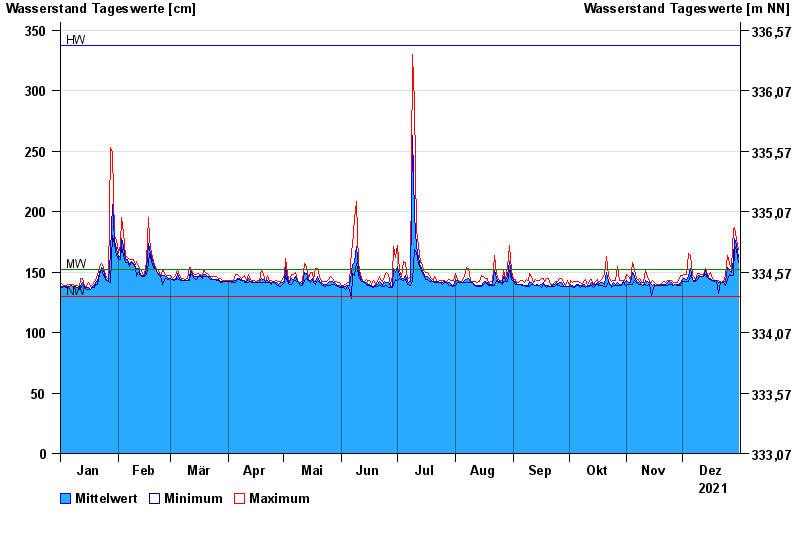
Chart of year Bruckberg / Haselbach
Waterlevel from 01.01.2021 to 31.12.2021
| Date | Mean value [cm] | Maximum [cm] | Minimum [cm] |
|---|---|---|---|
| 31.12.2021 | 162 | 169 | 158 |
| 30.12.2021 | 173 | 177 | 169 |
| 29.12.2021 | 178 | 187 | 171 |
| 28.12.2021 | 160 | 186 | 147 |
| 27.12.2021 | 150 | 153 | 147 |
| 26.12.2021 | 151 | 157 | 148 |
| 25.12.2021 | 154 | 164 | 144 |
© Bayerisches Landesamt für Umwelt 2024