
- Start >
- Rivers >
- Waterlevel >
- Obere Donau >
- Wiblingen >
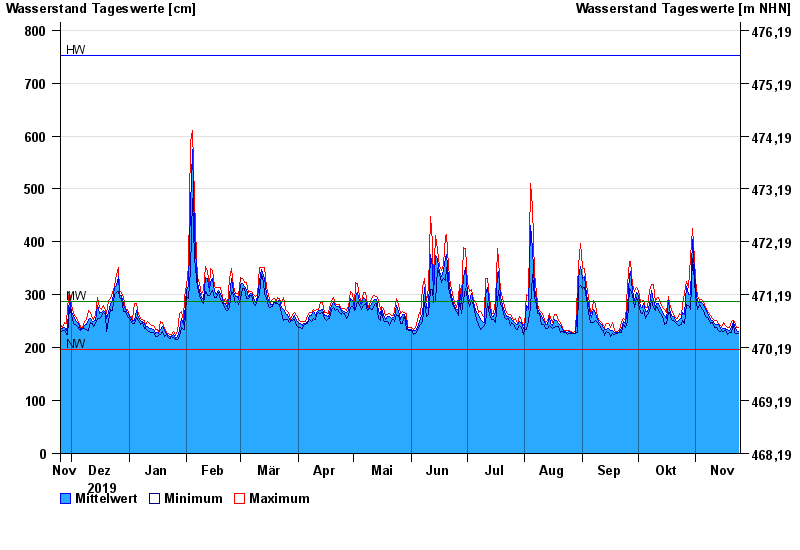
- Chart of year

Chart of year Wiblingen / Iller
Waterlevel from 25.11.2019 to 24.11.2020
| Date | Mean value [cm] | Maximum [cm] | Minimum [cm] |
|---|---|---|---|
| 24.11.2020 | 231 | 239 | 227 |
| 23.11.2020 | 233 | 239 | 227 |
| 22.11.2020 | 240 | 249 | 228 |
| 21.11.2020 | 249 | 252 | 246 |
| 20.11.2020 | 238 | 249 | 229 |
| 19.11.2020 | 232 | 238 | 229 |
| 18.11.2020 | 234 | 239 | 224 |
© Bayerisches Landesamt für Umwelt 2024