
- Start >
- Rivers >
- Waterlevel >
- Obere Donau >
- Wiblingen >
- Chart of year

Chart of year Wiblingen / Iller
Waterlevel from 07.06.2020 to 06.06.2021
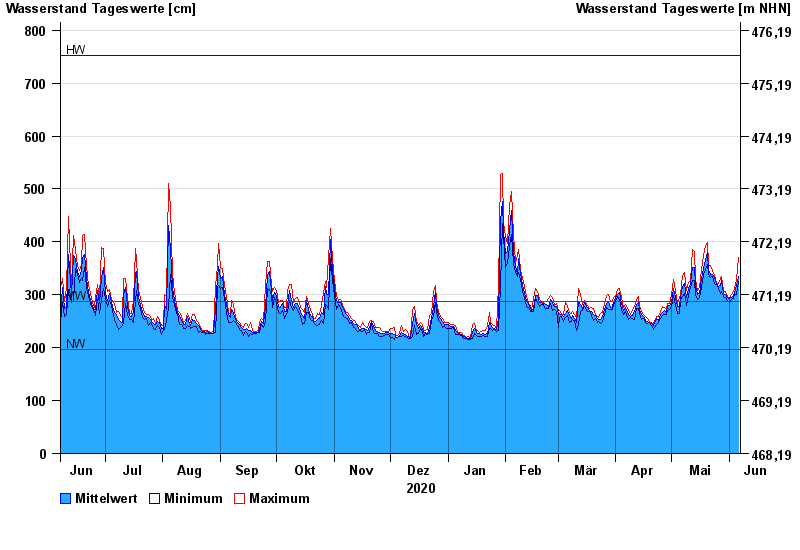
| Date | Mean value [cm] | Maximum [cm] | Minimum [cm] |
|---|---|---|---|
| 06.06.2021 | 335 | 370 | 326 |
| 05.06.2021 | 317 | 328 | 300 |
| 04.06.2021 | 304 | 311 | 300 |
| 03.06.2021 | 298 | 307 | 293 |
| 02.06.2021 | 295 | 301 | 291 |
| 01.06.2021 | 292 | 294 | 286 |
| 31.05.2021 | 295 | 297 | 290 |
© Bayerisches Landesamt für Umwelt 2024