
- Start >
- Rivers >
- Waterlevel >
- Obere Donau >
- Pfaffenhofen >
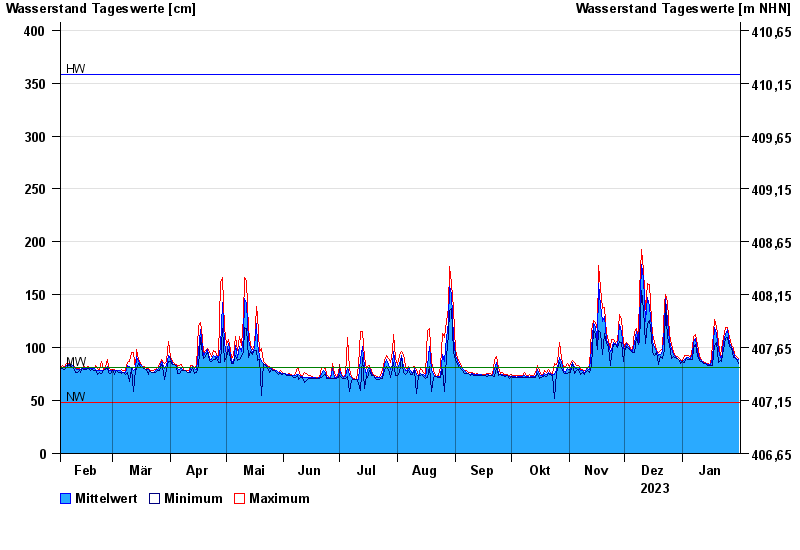
- Chart of year

Chart of year Pfaffenhofen / Zusam
Waterlevel from 01.02.2023 to 31.01.2024
| Date | Mean value [cm] | Maximum [cm] | Minimum [cm] |
|---|---|---|---|
| 31.01.2024 | 89 | 90 | 85 |
| 30.01.2024 | 90 | 92 | 89 |
| 29.01.2024 | 92 | 94 | 91 |
| 28.01.2024 | 95 | 100 | 91 |
| 27.01.2024 | 101 | 102 | 100 |
| 26.01.2024 | 104 | 110 | 101 |
| 25.01.2024 | 117 | 119 | 110 |
© Bayerisches Landesamt für Umwelt 2024