
- Start >
- Rivers >
- Waterlevel >
- Obere Donau >
- Oberndorf >
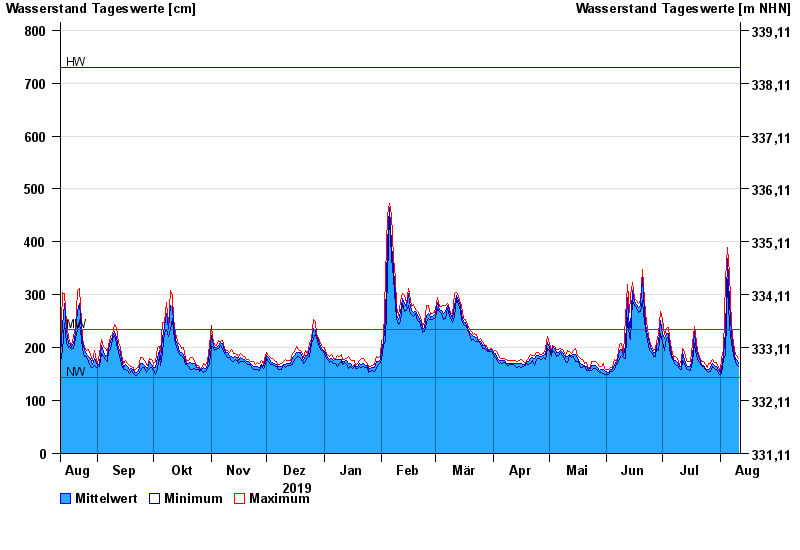
- Chart of year

Chart of year Oberndorf / Donau
Waterlevel from 12.08.2019 to 11.08.2020
| Date | Mean value [cm] | Maximum [cm] | Minimum [cm] |
|---|---|---|---|
| 11.08.2020 | 170 | 179 | 165 |
| 10.08.2020 | 177 | 185 | 169 |
| 09.08.2020 | 178 | 187 | 173 |
| 08.08.2020 | 196 | 207 | 186 |
| 07.08.2020 | 225 | 244 | 207 |
| 06.08.2020 | 288 | 341 | 239 |
| 05.08.2020 | 369 | 389 | 329 |
© Bayerisches Landesamt für Umwelt 2024