
- Start >
- Rivers >
- Waterlevel >
- Obere Donau >
- Neumühle >
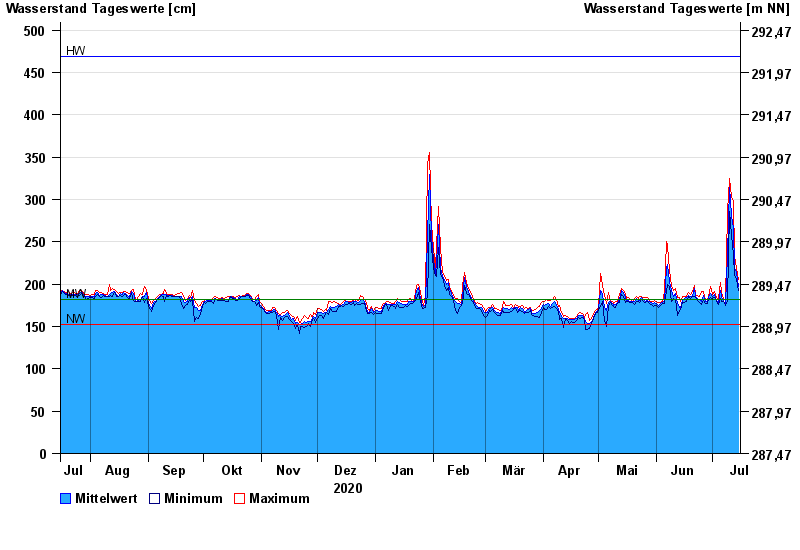
- Chart of year

Chart of year Neumühle / Rednitz
Waterlevel from 16.07.2020 to 15.07.2021
| Date | Mean value [cm] | Maximum [cm] | Minimum [cm] |
|---|---|---|---|
| 15.07.2021 | 197 | 205 | 192 |
| 14.07.2021 | 214 | 218 | 205 |
| 13.07.2021 | 219 | 234 | 211 |
| 12.07.2021 | 266 | 298 | 234 |
| 11.07.2021 | 281 | 303 | 258 |
| 10.07.2021 | 314 | 325 | 286 |
| 09.07.2021 | 235 | 286 | 181 |
© Bayerisches Landesamt für Umwelt 2024