
- Start >
- Rivers >
- Waterlevel >
- Obere Donau >
- Neumühle >
- Chart of year

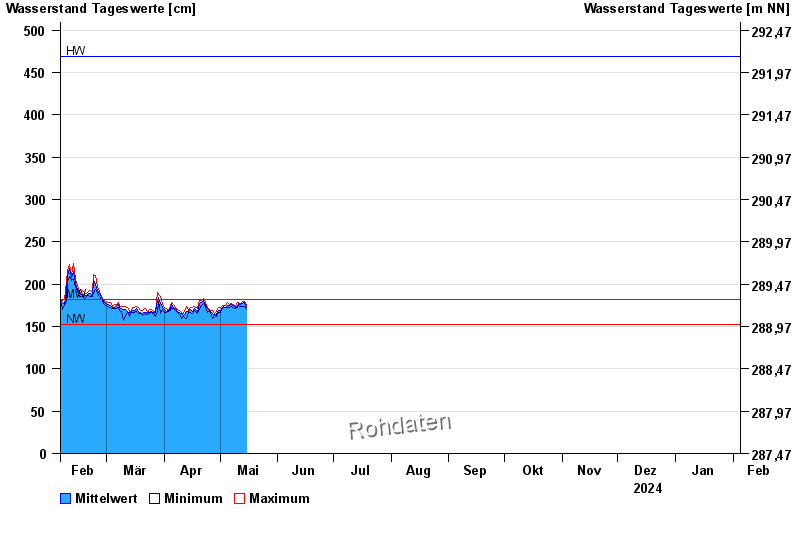
Chart of year Neumühle / Rednitz
Waterlevel from 05.02.2024 to 04.02.2025
| Date | Mean value [cm] | Maximum [cm] | Minimum [cm] |
|---|---|---|---|
| 04.06.2024 | 282 | 285 | 278 |
| 03.06.2024 | 333 | 359 | 286 |
| 02.06.2024 | 297 | 343 | 257 |
| 01.06.2024 | 207 | 255 | 181 |
| 31.05.2024 | 173 | 182 | 170 |
| 30.05.2024 | 167 | 181 | 157 |
| 29.05.2024 | 167 | 171 | 164 |
© Bayerisches Landesamt für Umwelt 2024