
- Start >
- Rivers >
- Waterlevel >
- Obere Donau >
- Freising >
- Chart of year

Chart of year Freising / Moosach
Waterlevel from 29.03.2024 to 28.03.2025
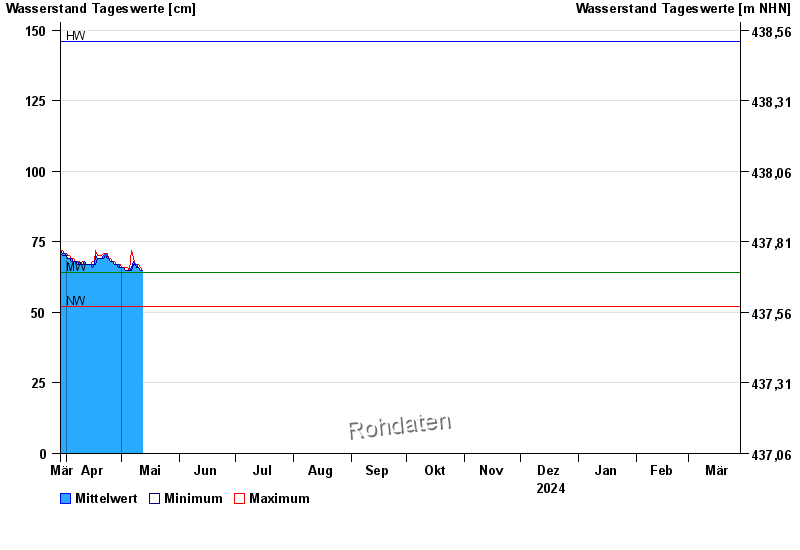
| Date | Mean value [cm] | Maximum [cm] | Minimum [cm] |
|---|---|---|---|
| 28.04.2024 | 67 | 67 | 67 |
| 27.04.2024 | 67 | 68 | 67 |
| 26.04.2024 | 68 | 68 | 68 |
| 25.04.2024 | 68 | 69 | 68 |
| 24.04.2024 | 69 | 69 | 69 |
| 23.04.2024 | 70 | 71 | 69 |
| 22.04.2024 | 71 | 71 | 70 |
© Bayerisches Landesamt für Umwelt 2024