
- Start >
- Rivers >
- Waterlevel >
- Obere Donau >
- Freising >
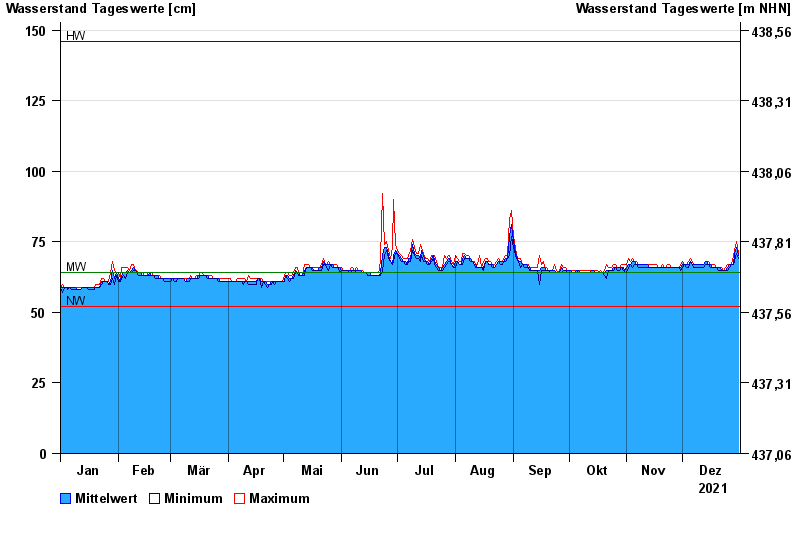
- Chart of year

Chart of year Freising / Moosach
Waterlevel from 01.01.2021 to 31.12.2021
| Date | Mean value [cm] | Maximum [cm] | Minimum [cm] |
|---|---|---|---|
| 31.12.2021 | 70 | 71 | 69 |
| 30.12.2021 | 73 | 75 | 71 |
| 29.12.2021 | 71 | 72 | 68 |
| 28.12.2021 | 67 | 70 | 67 |
| 27.12.2021 | 67 | 67 | 67 |
| 26.12.2021 | 67 | 67 | 66 |
| 25.12.2021 | 66 | 67 | 65 |
© Bayerisches Landesamt für Umwelt 2024