
- Start >
- Rivers >
- Waterlevel >
- Obere Donau >
- Fischach >
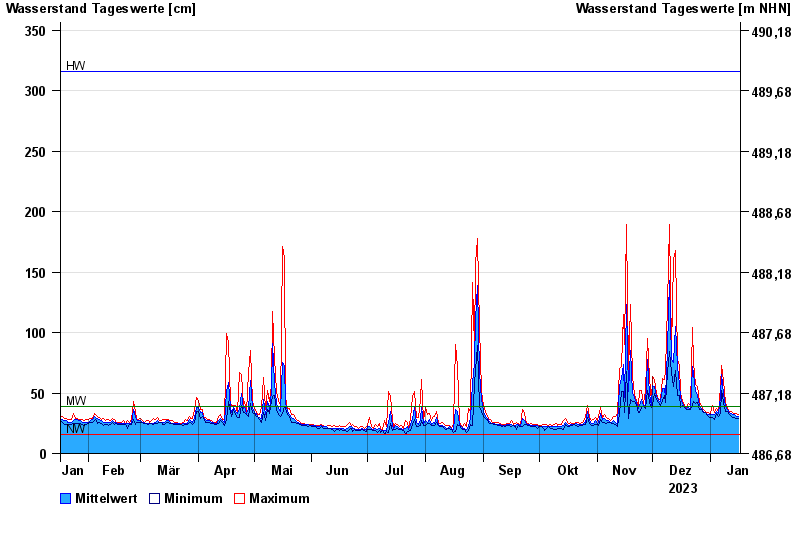
- Chart of year

Chart of year Fischach / Schmutter
Waterlevel from 17.01.2023 to 16.01.2024
| Date | Mean value [cm] | Maximum [cm] | Minimum [cm] |
|---|---|---|---|
| 16.01.2024 | 31 | 32 | 29 |
| 15.01.2024 | 31 | 33 | 29 |
| 14.01.2024 | 32 | 33 | 30 |
| 13.01.2024 | 32 | 33 | 30 |
| 12.01.2024 | 33 | 35 | 31 |
| 11.01.2024 | 34 | 35 | 32 |
| 10.01.2024 | 36 | 37 | 35 |
© Bayerisches Landesamt für Umwelt 2024